Statistics
Analyze your training load and better understand your progress
The Statistics screen gives you a clearer view of your workouts so you can better understand how you are progressing, how much you are training, and which areas of the body you are working the most.
You can access it from Profile, inside the Activity tab, by tapping See more on the card that contains the estimated load chart.
Date filter
At the top of the screen you will find a filter to choose the data range you want to review:
- Last 7 days
- Last 30 days
- All time
- Custom range, to select the exact dates you want to analyze
All sections update based on the selected range, so you can review a specific week, a training phase, or your full evolution.
1. Training summary
The first block shows a quick summary of your stats for the selected period. Here you can check:
- Hours trained: the total time spent in your sessions.
- Sessions: the number of completed workouts.
- Energy: the estimated kilocalories you have burned.
- KI: a load score that summarizes the points generated by your training sessions.
This block is designed to help you understand, at a glance, whether you have kept your rhythm and what your activity looked like in the selected range.
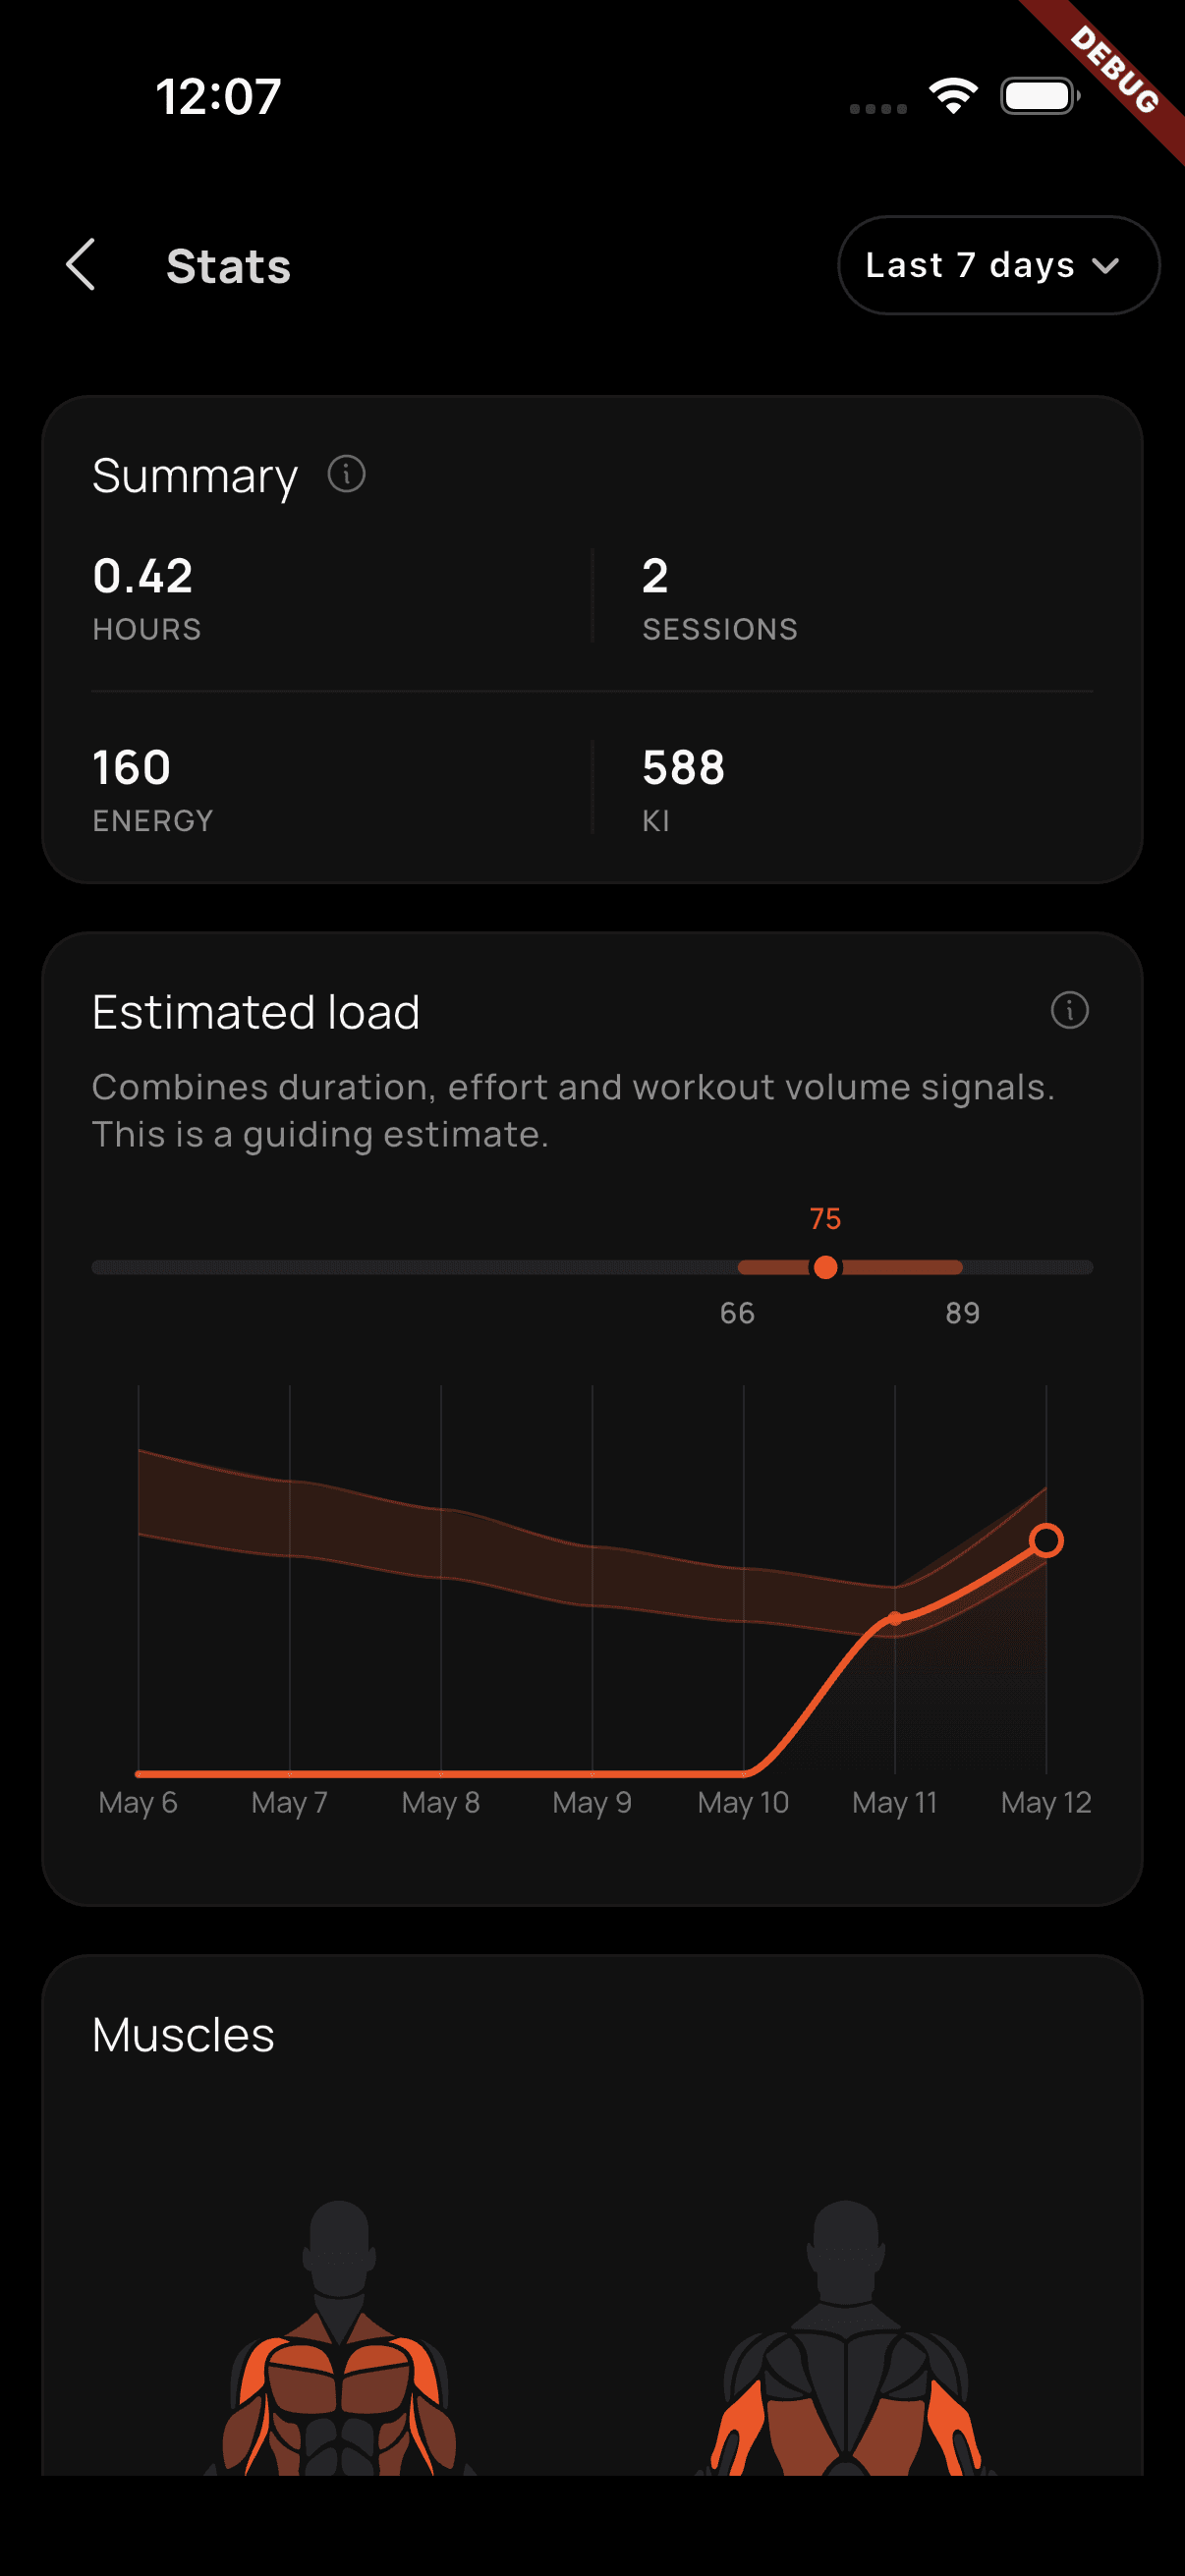
2. Estimated load
The second block shows Estimated load, an orientative chart that combines duration, effort, and training volume signals to estimate the load you accumulated each day.
The chart includes a 15% margin around the recommended estimated load range. This band helps you visualize a more controlled progression: increasing the stimulus when needed while avoiding jumps that are too abrupt from one day to the next.
The information is shown by day and adapts to the filter you selected. If you choose the last 7 days, you will get a more weekly view; if you expand the range, you can better observe trends, load peaks, and periods where you eased off.
3. Worked muscles
The last section shows a visual body map with the muscles you worked during the selected date range.
Alongside the image, you will see percentages that indicate which muscle groups received the most stimulus. This helps you spot whether your training is balanced, whether you are repeating one area too often, or whether there are muscles you could include more in your next sessions.